When to use Activity Diagram?
Developers use activity diagrams to understand the high-level flow of a program. It also allows them to identify the constraints and conditions that trigger specific events.
- Represent business workflows
- Identify candidate use cases, through the examination of business workflows
- Identify pre- and post-conditions (the context) for use cases
- Model workflows between/within use cases
- Model complex workflows in operations on objects
- Model in detail complex activities in a high level activity Diagram
Basic components of an activity diagram
An activity diagram is basically a flowchart that represents the flow from one activity to another. An activity can be described as an operation of the system. The basic purpose of an activity diagram is to capture the dynamic behavior of the system. It is also referred to as an object-oriented flowchart.
The activity diagram’s notation is also very similar to that of a state machine diagram. In fact, according to the UML specification, an activity diagram is a variation of a state machine diagram.
Actions
Action is a named element which represents a single atomic step within activity i.e. that is not further decomposed within the activity.
![]()
Activity
Activity represents a behavior that is composed of individual elements that are activity nodes which could be:
- action
- object
- control flow
Control Flow
A Control Flow represents a transfer of execution control from one action to another action.
It is drawn as a solid line with a line-arrow at one end pointing to the next action.
ExampleWhen the Fill Order action is ended, the execution control is transferred to the Ship Order action.
![]()
Start and Final
They represent the starting point and the ending point of an action execution sequence within an activity. Start Notation and Final Notation are also called Initial State notation and Final State.
- A Start element is drawn as a small solid circle.
- A Final element is drawn as a small solid circle enclosed in an outer circle.
Example
![]()
Decision
It represents a decision action that evaluates certain conditions and decides which action path to continue the execution.
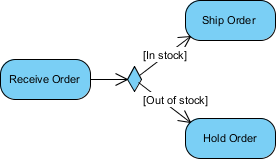
A Decision Notation is drawn as a small diamond shape with one incoming control flow and multiple outgoing control flows.
Each outgoing control flow should be labeled with the condition that leads to this flow.
Example
The decision action performed after the Receive Order action to check the stock can be drawn in the diagram as shown below:
Merge
It represents a merge point where multiple alternate execution paths will meet and continue.
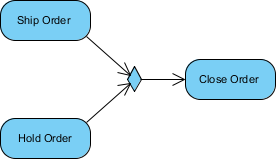
It is drawn as a small diamond shape with multiple incoming control flows and on outgoing control flow.
Example
The merge point where Ship Order and Hold Order meet can be drawn in the diagram as a Merge Notation as shown below:
Fork
It represents a fork action that splits a single execution flow into multiple concurrent execution flows.
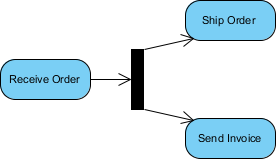
It is drawn as a short solid line with one incoming control flow on one side and multiple outgoing control flows on the other side.
Example
The fork action performed after the Receive Order action to start Ship Order action and Send Invoice action concurrently can be drawn in the diagram as shown below:
Join
It represents a join action that waits for multiple concurrent execution flows to finish.
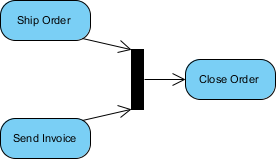
It is drawn as a short solid line with multiple incoming control flows on one side and one outgoing control flows on the other side.
Example
Join action performed before the Close Order action to wait for both Ship Order action and Send Invoice action to finish can be drawn as in the diagram as shown below:
Object
It represents an object which could be an input and/or an output of an action. An object in this case is considered as an instance of a class in a given state.
It is represented by a rectangle with its name placed inside.
It can also be qualified by a state written within brackets below the name.
Example
Order [Filled] object generated from the Fill Order action will be consumed by the Ship Order action. This object can be drawn as an Object Notation in a UML activity diagram as shown below:
![]() Different notations with same semantics:
Different notations with same semantics:
![]()
Signal and Event
It represents a signal action that sends a signal to outside of the activity. The send signal action does not wait for any responses from the receiver of the signal. It ends itself and passes the execution control to the next action.
It is drawn as a convex pentagon with its name placed inside.
Example
The Notify Customer send signal action in an order processing activity can be drawn as a Send Signal Notation in a UML activity diagram as shown below:
![]()
Swimlane and Partition
- Partition presents a group of actions and objects that share some common properties.
- It is drawn as two parallel lines with the partition name as one end.
- Any actions and objects that are located within the two lines are considered to be in the group.
- If an action or object may located on the border of multiple partitions, is considered to be in multiple groups.
- Partitions can be nested to form a hierarchy of partitions.
Example
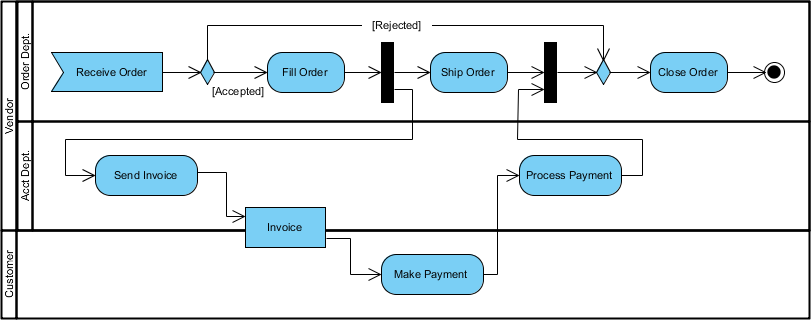
Actions and objects in an order processing activity can be divided into 3 groups:
- Order Department action group
- Accounting Department action group
- Customer action group, based on action ownerships
These groups can be drawn as Partition Notations in a UML activity diagram as shown below:
Parameterized Activity
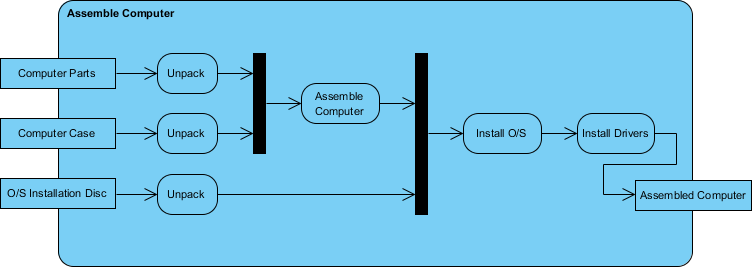
An Activity Parameter Activity accepts input to an Activity or provides output from an Activity.
Activity parameters are displayed on the border and listed below the activity name as: parameter-name: parameter-type.
Example
The following example depicts two entry parameters and one output parameter defined for the Activity.
Activity Frame
It is used in a UML Activity Diagram to provide a boundary to enclose all actions and objects of the activity.
It is drawn as a large rectangle with rounded corners. The activity name, input parameters and output parameters are written near the top left corner of the rectangle.
Object Notations representing input parameters and output parameters can be placed on edges of the rectangle.
Why Use Activity Diagrams?
Activity diagrams in UML allow you to create an event as an activity, which contains a collection of nodes connected by edges. An activity can be attached to any modeling element to model its behavior. Activity diagrams are often used for elaborating.
- Use Cases
- Classes
- Component and subsystem
- Workflow and business process
More Activity Diagram Examples
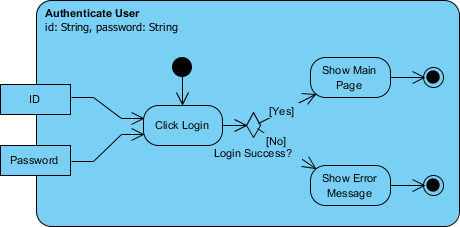
Example: Activity Diagram – Notations
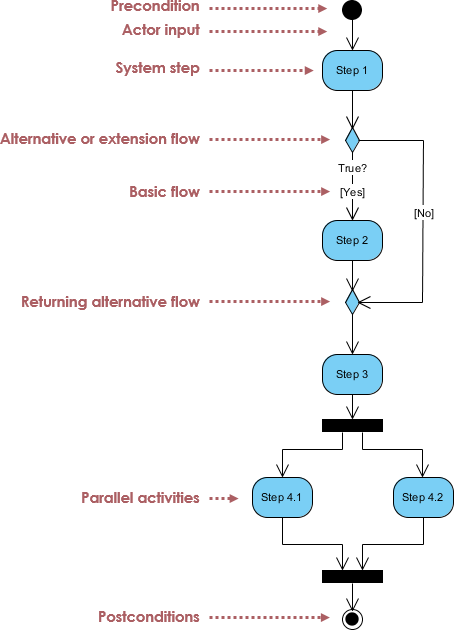
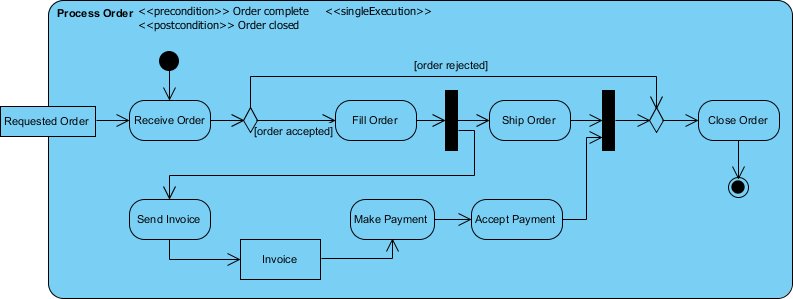
Example: Activity Diagram – Process Order
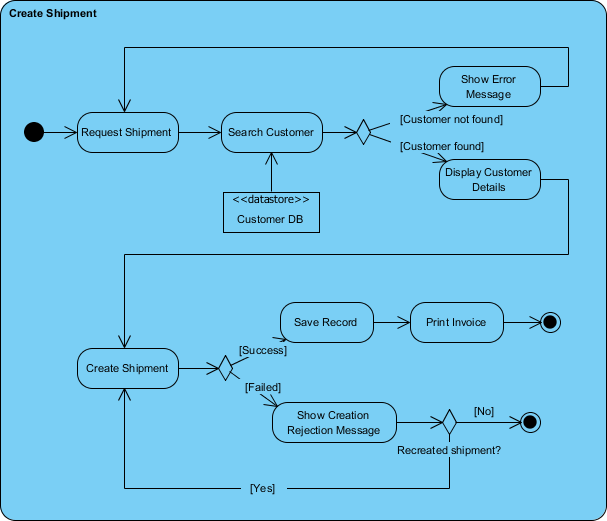
Example: Activity Diagram – Create Shipment
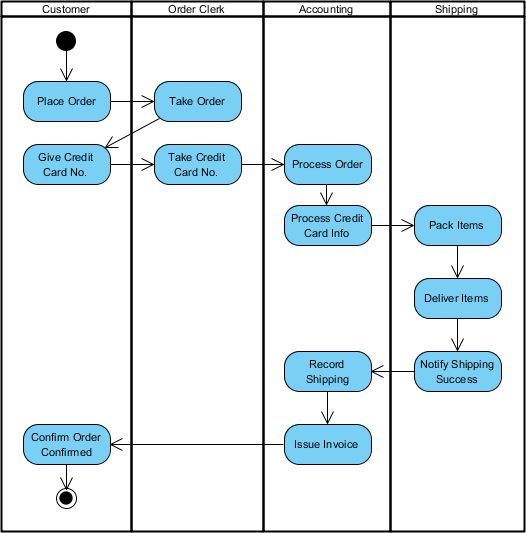
Example: Activity Diagram Swimlane
Resources
- How to Draw an Activity Diagram in UML? – Visual Paradigm
- Visual Paradigm. (n.d.). How to Draw an Activity Diagram in UML? – Visual Paradigm .
- Visual Paradigm Online – Google Workspace Marketplace
- Google Workspace Marketplace. (n.d.). Visual Paradigm Online – Google Workspace Marketplace .
- Introduction to UML Diagrams in Visual Paradigm – ArchiMetric
- ArchiMetric. (2024, August 23). Introduction to UML Diagrams in Visual Paradigm – ArchiMetric .
- Visual Paradigm Sub-activity diagram icon – Stack Overflow
- Stack Overflow. (n.d.). Visual Paradigm Sub-activity diagram icon – Stack Overflow .
- Online UML Diagram Tool
- Visual Paradigm. (n.d.). Online UML Diagram Tool.
- Activity Diagrams – Unified Modeling Language (UML) – GeeksforGeeks
- GeeksforGeeks. (2017, October 27). Activity Diagrams – Unified Modeling Language (UML) – GeeksforGeeks.
- Create a UML activity diagram – Microsoft Support
- Microsoft Support. (n.d.). Create a UML activity diagram – Microsoft Support.
- UML Class Diagram Tutorial
- Visual Paradigm. (n.d.). UML Class Diagram Tutorial .
- Difference between the Domain Model & Activity Diagram – Stack Overflow
- Stack Overflow. (n.d.). Difference between the Domain Model & Activity Diagram – Stack Overflow .