Introduction
In the realm of software engineering and system design, visualizing and communicating architectural information is crucial for effective collaboration, decision-making, and understanding the system’s structure. Unified Modeling Language (UML) provides a standard notation for creating diagrams that capture different aspects of a system. One such type of diagram is the Deployment Diagram, which focuses on the static aspects of the system, such as hardware, software, data, and their relationships. This article explores the purpose, components, and best practices of UML Deployment Diagrams.
1. Purpose of Deployment Diagrams
The primary purpose of Deployment Diagrams is to illustrate the deployment of artifacts onto nodes within a specific environment. They help answer questions such as:
- What hardware and software components are required to run the system?
- How are the system’s components distributed across different nodes or environments?
- What are the dependencies between the system’s components, and how do they interact?
- How does the system’s architecture support its intended functionality and performance?
By providing a visual representation of the system’s deployment architecture, Deployment Diagrams serve the following purposes:
- Communication: They facilitate communication among stakeholders, including developers, architects, project managers, and clients, by providing a common language and visual aid to discuss the system’s architecture.
- Documentation: Deployment Diagrams serve as a tangible record of the system’s deployment architecture, aiding in knowledge transfer, maintenance, and future enhancements.
- Decision-making: By visualizing the system’s deployment architecture, stakeholders can make informed decisions about system design, scalability, and performance.
- Validation: Deployment Diagrams help validate the system’s architecture by ensuring it meets the intended goals, requirements, and constraints.
2. Components of Deployment Diagrams
Deployment Diagrams consist of several key components, represented using specific UML notation:
- Artifacts: Deployable units, such as components, objects, or processes, that need to be deployed in the system. Artifacts are represented by a cylinder shape. Examples include executable files, libraries, or databases.
- Nodes: Hardware devices or software containers where artifacts are deployed. Nodes are depicted as three-dimensional boxes. Examples include servers, clients, or virtual machines.
- Relationships: Connections between artifacts and nodes, as well as between nodes themselves, indicating how they interact or depend on each other. Relationships are represented by communication lines, deploy lines, and association lines.
- Communication lines: Show interaction between nodes, usually for sending and receiving data.
- Deploy lines: Indicate the deployment of artifacts onto nodes.
- Association lines: Represent dependencies between artifacts.
- Dependencies: Relationships between artifacts that indicate one artifact relies on another for its proper functioning. Dependency lines are represented by dashed lines with an open arrowhead.
- Groups: Rectangles that organize related artifacts or nodes, helping to create modular and structured diagrams.
3. Best Practices for Creating Deployment Diagrams
To create effective Deployment Diagrams, consider the following best practices:
- Focus on static aspects: Concentrate on the hardware, software, and data components of the system, avoiding dynamic aspects like behavior or interaction. Use other UML diagrams, such as Sequence or Activity Diagrams, to capture dynamic information.
- Keep it relevant: Include only the necessary components and interactions to illustrate the system’s deployment architecture effectively. Avoid cluttering the diagram with excessive details.
- Use clear and concise labels: Employ a consistent labeling system for artifacts, nodes, and relationships to enhance readability and understanding. Use annotations judiciously to provide additional context without overwhelming the diagram.
- Maintain consistency: Follow a consistent notation and style throughout the Deployment Diagram. Use tools or software to generate and maintain the diagram, ensuring consistency and accuracy.
- Keep diagrams up-to-date: Regularly review and update Deployment Diagrams as the system evolves or changes to ensure they remain relevant and accurate.
- Collaborate and review: Engage with stakeholders, such as developers, architects, and project managers, to create Deployment Diagrams that accurately represent the system’s deployment architecture. Review and refine the diagrams based on feedback.
Deployment diagram Example – a distributed mortgage application system
The deployment diagram illustrates the architecture of a distributed mortgage application system, consisting of the following key components:
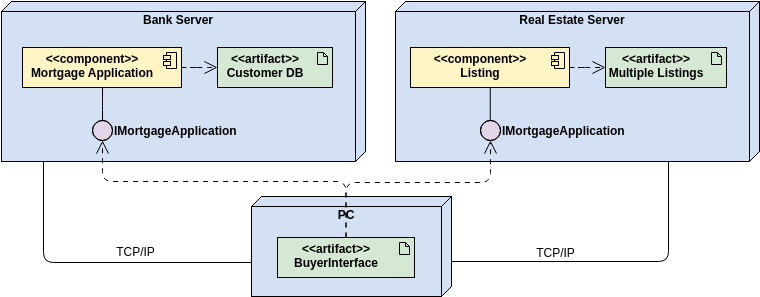
- Bank Server:
- This server houses the “Mortgage Application” component, which represents the functionality for processing customer mortgage applications.
- The “Customer DB” artifact is associated with the Mortgage Application, indicating that the server maintains a database of customer information.
- Real Estate Server:
- This server contains the “Listing” component, which represents the functionality for managing and storing real estate listings.
- The “Multiple Listings” artifact is associated with the Listing component, suggesting that the server maintains a database of multiple real estate listings.
- PC:
- The “Buyer Interface” component is located on the PC, representing the user interface or application that customers use to interact with the mortgage application system.
The diagram suggests a decoupled and distributed architecture, where the mortgage application processing and real estate listing management are handled by separate server components, connected via TCP/IP communication.
This design allows for the separation of concerns, where the Bank Server focuses on mortgage application processing and customer data management, while the Real Estate Server handles the real estate listing functionality. The Buyer Interface on the PC acts as the central point of interaction for users, communicating with both the Bank Server and Real Estate Server as needed.
The decoupled nature of the architecture likely allows for independent scaling, maintenance, and updates of the individual components, improving the overall flexibility and scalability of the mortgage application system. Additionally, the separation of concerns can enhance security by limiting the exposure of sensitive customer data to the real estate-related components.
Overall, the deployment diagram depicts a modular and distributed architecture for a mortgage application system, with a centralized buyer interface and separate server components for mortgage processing and real estate listing management. This design approach aims to provide a scalable, secure, and flexible solution for mortgage application handling.
Conclusion
Deployment Diagrams play a vital role in visualizing and communicating the deployment architecture of a system. By understanding the purpose, components, and best practices of Deployment Diagrams, you can create effective diagrams that support better collaboration, decision-making, and system design. Incorporating Deployment Diagrams into your software engineering and system design processes will help you create more maintainable, scalable, and performant systems.
References
Here is a summarized list of references with URLs based on the provided content:
- Deployment Diagram Tutorial – Visual Paradigm
Learn what a deployment diagram is and how to draw one in UML.
https://online.visual-paradigm.com/diagrams/tutorials/deployment-diagram-tutorial - Free Deployment Diagram Tool – Visual Paradigm
A free web-based UML drawing tool that supports Deployment Diagrams.
https://online.visual-paradigm.com/diagrams/solutions/free-deployment-diagram-tool - Deployment Diagram – Visual Paradigm
Overview of deployment diagrams, including nodes and relationships.
https://www.visual-paradigm.com/learning/handbooks/software-design-handbook/deployment-diagram.jsp - Online Deployment Diagram Tool – Visual Paradigm
Create and share deployment diagrams online with VP Online.
https://online.visual-paradigm.com/diagrams/features/deployment-diagram-software - How to Draw a Deployment Diagram in UML? – Visual Paradigm
Step-by-step guide to developing a deployment diagram.
https://www.visual-paradigm.com/tutorials/how-to-draw-deployment-diagram-in-uml - How to draw a Deployment Diagram in UML – Visual Paradigm
Instructions for creating a UML deployment diagram.
https://circle.visual-paradigm.com/docs/uml-and-sysml/deployment-diagram/how-to-draw-a-deployment-diagram-in-uml - Beginner’s Guide to Deployment Diagrams with Visual Paradigm Online
A guide to creating deployment diagrams with templates and examples.
https://blog.visual-paradigm.com/beginners-guide-to-deployment-diagrams-with-visual-paradigm-online - Modeling a Distributed System Using Deployment Diagram
Overview of UML Deployment Diagrams for modeling software components.
https://guides.visual-paradigm.com/modeling-a-distributed-system-using-deployment-diagram - Deployment Diagram – Visual Paradigm Community Circle
Explanation of deployment diagrams in the context of physical deployment of artifacts.
https://circle.visual-paradigm.com/docs/uml-and-sysml/deployment-diagram
