


Deployment diagrams are a fundamental part of the Unified Modeling Language (UML) that provide a visual representation of the physical deployment of artifacts on nodes. They are essential for understanding how software components are distributed across hardware, which is crucial for system performance, scalability, and reliability. This tutorial will guide you through the concepts and creation of deployment diagrams using Visual Paradigm, referencing various articles to enhance your learning experience.
What is a Deployment Diagram?
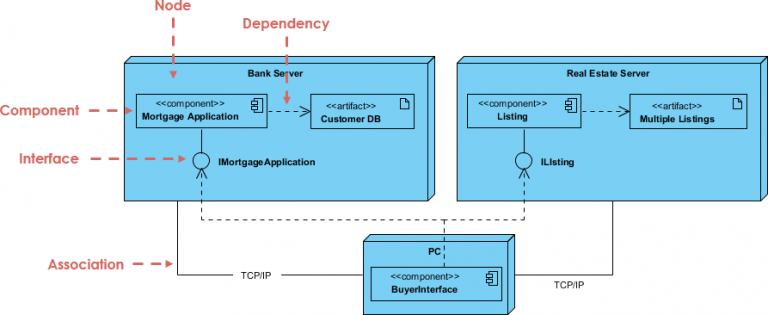
A deployment diagram illustrates the configuration of runtime processing nodes and the components that reside on them. It is essential for understanding the physical architecture of a system. Key elements of a deployment diagram include:
- Nodes: These represent physical devices or environments where software components are deployed, such as servers, workstations, or cloud environments.
- Artifacts: These are the physical files or executables that are deployed on the nodes, such as libraries, executables, or configuration files.
- Associations: These show the relationships between nodes and artifacts, indicating how they interact with each other.
For a more detailed overview of deployment diagrams, refer to the Deployment Diagram Overview.
Importance of Deployment Diagrams
Deployment diagrams play a crucial role in system design and architecture. They help stakeholders understand how software components are distributed across hardware, which is essential for:
- Performance Analysis: By visualizing the deployment, teams can identify potential bottlenecks and optimize resource allocation.
- Scalability Planning: Understanding the physical layout helps in planning for future growth and scaling of the system.
- Reliability Assessment: Deployment diagrams can highlight single points of failure and help in designing redundancy into the system.
For more insights into the significance of deployment diagrams, check out the article on Modeling a Distributed System Using Deployment Diagram.
Creating a Deployment Diagram in Visual Paradigm
Visual Paradigm for UML provides a user-friendly interface for creating deployment diagrams. Here’s a step-by-step guide to help you get started:
Step 1: Open Visual Paradigm
Begin by launching Visual Paradigm Online. If you don’t have it installed, you can use the free online version available on their website.
Step 2: Create a New Project
Once you have opened Visual Paradigm, create a new project by selecting “New Project” from the main menu. This will allow you to start fresh and organize your deployment diagram effectively.
Step 3: Add a Deployment Diagram
To add a deployment diagram, navigate to the “Diagrams” menu, select “Deployment Diagram,” and click on “Create.” This will open a blank canvas where you can start building your diagram. For more details, check the Deployment Diagram Tutorial.
Step 4: Add Nodes
To represent the physical devices, use the node shape from the diagram toolbar. Drag and drop the node shape onto the canvas. You can customize the node by double-clicking on it to edit its properties, such as name and type. For more information on nodes, refer to the Deployment Diagram Basics.
Step 5: Add Artifacts
Next, add artifacts to your diagram. Artifacts can be represented using the artifact shape available in the toolbar. Place the artifact shapes on the nodes to indicate which components are deployed on which devices. For a detailed guide on adding artifacts, see the article on How to Draw a Deployment Diagram in UML.
Step 6: Define Associations
To show the relationships between nodes and artifacts, use the association line tool. Click on the node and drag the line to the artifact to create an association. You can also label the associations to provide more context about the interactions.
Step 7: Customize and Save
Once you have added all the necessary elements, customize your diagram by adjusting colors, fonts, and layout. After finalizing your deployment diagram, save your project by clicking on “File” and then “Save.” For more tips on customization, visit the Visual Paradigm Customization Guide.
Benefits of Using Visual Paradigm for UML
Visual Paradigm for UML offers several advantages for creating deployment diagrams:
- User-Friendly Interface: The intuitive drag-and-drop interface makes it easy to create and modify diagrams without extensive training.
- Collaboration Features: Visual Paradigm supports team collaboration, allowing multiple users to work on the same project simultaneously. Learn more about collaboration features here.
- Integration with Other Diagrams: You can easily integrate deployment diagrams with other UML diagrams, such as class diagrams and sequence diagrams, to provide a comprehensive view of your system architecture.
- Export Options: Visual Paradigm allows you to export your diagrams in various formats, including PNG, PDF, and SVG, making it easy to share with stakeholders. For more on export options, check the Free Deployment Diagram Tool.
Conclusion
Deployment diagrams are vital for understanding the physical architecture of a system. With Visual Paradigm Online, creating deployment diagrams becomes a straightforward process. By following the steps outlined in this tutorial, you can effectively visualize the deployment of your software components, enhancing communication and understanding among your development team and stakeholders.
For more information on deployment diagrams and other UML tools, visit the Visual Paradigm website. This comprehensive tutorial should equip you with the knowledge to create effective deployment diagrams and leverage them in your software development projects.
References
- What is Deployment Diagram?
- Visual Paradigm. (n.d.). What is Deployment Diagram? .
- Introduction to UML Diagrams in Visual Paradigm
- ArchiMetric. (2024, August 23). Introduction to UML Diagrams in Visual Paradigm .
- Deployment Diagram Tutorial
- Lucidchart. (n.d.). Deployment Diagram Tutorial .
- Deployment Diagram in Unified Modeling Language(UML)
- GeeksforGeeks. (2024, October 16). Deployment Diagram in Unified Modeling Language(UML) .
- How to Draw a Deployment Diagram in UML?
- Visual Paradigm. (n.d.). How to Draw a Deployment Diagram in UML? .
- Comprehensive Tutorial on Deployment Diagrams with Visual Paradigm
- ArchiMetric. (2024, August 23). Comprehensive Tutorial on Deployment Diagrams with Visual Paradigm .
- The UML notations of Visual Paradigm
- ResearchGate. (n.d.). The UML notations of Visual Paradigm .
- Unified Modeling Language (UML) Diagrams
- GeeksforGeeks. (2017, October 27). Unified Modeling Language (UML) Diagrams .
- Deployment Diagram, UML Diagrams Example: Deployment Diagram with Components
- Visual Paradigm Community Circle. (2018, September 24). Deployment Diagram, UML Diagrams Example: Deployment Diagram with Components .
- Create a UML deployment diagram
- Microsoft Support. (n.d.). Create a UML deployment diagram .
