1. Introduction
In the realm of software engineering, understanding system architecture is crucial for effective communication, collaboration, and decision-making. Unified Modeling Language (UML) plays a significant role in documenting and communicating this architectural information, with deployment diagrams being one of its vital components. This tutorial aims to provide a comprehensive guide to understanding, creating, and interpreting UML Deployment Diagrams.
2. Prerequisites
Before diving into UML Deployment Diagrams, ensure you have a basic understanding of the following:
- Object-Oriented Programming (OOP) concepts
- Basic UML notation and diagrams (e.g., Use Case, Class, Sequence, and Activity Diagrams)
- Software architecture and system design principles
3. Understanding UML Deployment Diagrams
UML Deployment Diagrams, also known as Deployment Diagrams, are a type of system diagram that helps visualize the deployment of artifacts (e.g., components, objects, or processes) onto nodes (e.g., hardware devices or software containers) in a system. They focus on the static aspects of the system, such as the hardware, software, and data, as well as their relationships and dependencies.
4. Key Components of UML Deployment Diagrams
UML Deployment Diagrams consist of the following key components:
- Artifacts: These are the deployable units, such as components, objects, or processes, that need to be deployed in the system. They are represented by a cylinder shape.
- Nodes: Nodes represent the hardware devices or software containers where artifacts are deployed. They are depicted as three-dimensional boxes.
- Relationships: Relationships between artifacts and nodes, as well as between nodes themselves, are shown using communication lines, deploy lines, and association lines.
- Dependencies: Dependencies between artifacts are represented by dependency lines, which indicate that one artifact depends on another for its proper functioning.
- Groups: Groups help organize the diagram by enclosing related artifacts or nodes within a rectangle.
5. How to Create a UML Deployment Diagram
5.1 Step 1: Identify the Elements
- Gather the relevant information about the system, including its hardware, software, and data components.
- Identify the artifacts, nodes, relationships, dependencies, and groups that need to be included in the deployment diagram.
5.2 Step 2: Determine the Interactions
- Understand the interactions between the system’s components, such as data flow, communication, or dependency.
- Identify any shared resources, such as databases or network connections, that need to be depicted in the diagram.
5.3 Step 3: Sketch the Diagram
- Start by drawing the nodes, representing the hardware devices or software containers in the system.
- Add the artifacts that need to be deployed onto these nodes.
- Connect the artifacts to their respective nodes using deploy lines.
- Add communication lines between nodes to show how they interact with each other.
- Include association lines between artifacts to depict dependencies.
5.4 Step 4: Add Details and Labels
- Add labels to the artifacts, nodes, and relationships to provide clarity and context.
- Use annotations to provide additional information about specific components or interactions.
- Include any relevant metadata, such as version numbers or configuration details, for the artifacts and nodes.
5.5 Step 5: Review and Refine
- Review the deployment diagram to ensure it accurately represents the system’s architecture.
- Make any necessary refinements or adjustments based on feedback from stakeholders or further analysis.
- Consider using tools or software to generate and maintain the deployment diagram, ensuring consistency and accuracy.
6. Reading and Interpreting UML Deployment Diagrams
When reading and interpreting UML Deployment Diagrams, pay close attention to the following aspects:
- Artifacts: Identify the deployable units and understand their purpose and functionality.
- Nodes: Recognize the hardware devices or software containers and their roles in the system.
- Relationships: Analyze the connections between artifacts and nodes, as well as between nodes themselves, to understand the system’s architecture and communication flow.
- Dependencies: Evaluate the dependencies between artifacts to identify potential risks or constraints in the system’s design.
- Groups: Identify any organized groups of artifacts or nodes to gain insights into the system’s modularity or structure.
7. Best Practices and Tips
- Keep deployment diagrams focused on the static aspects of the system, such as hardware, software, and data.
- Avoid including dynamic aspects, like behavior or interaction, in deployment diagrams. Use other UML diagrams, like Sequence or Activity Diagrams, to capture dynamic information.
- Maintain a clear and concise labeling system for artifacts, nodes, and relationships to enhance readability and understanding.
- Use annotations judiciously to provide additional context without overwhelming the diagram.
- Keep deployment diagrams up-to-date as the system evolves or changes to ensure they remain relevant and accurate.
Deployment Diagram Example
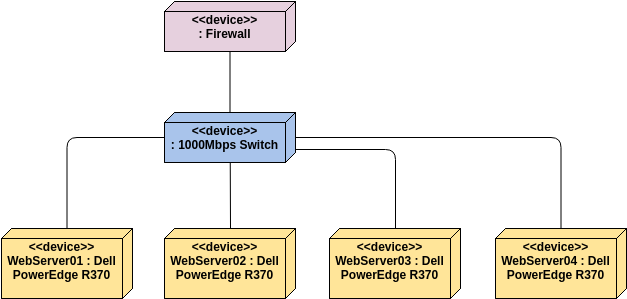
The deployment diagram illustrates the high-level architecture and infrastructure for a scalable and secure web application deployment within an enterprise environment. Let’s dive into the key components and their roles:
- Firewall: This device acts as the gateway, controlling and securing the inbound and outbound traffic to the web application infrastructure.
- 1000Mbps Switch: This high-speed network switch connects the various web servers and facilitates fast data transfer between the components.
- WebServer01: Dell PowerEdge R370
- WebServer02: Dell PowerEdge R370
- WebServer03: Dell PowerEdge R370
- WebServer04: Dell PowerEdge R370
These four Dell PowerEdge R370 web servers form the core of the application deployment. They are likely responsible for handling the user-facing web requests, application logic, and data processing.
The use of multiple web servers in this deployment diagram suggests a load-balanced and highly available architecture. This allows the system to scale horizontally by adding more web server instances as needed to handle increased user traffic and workload.
By distributing the web application across these four servers, the deployment achieves redundancy and fault tolerance. If one web server experiences issues, the load can be seamlessly shifted to the remaining servers, ensuring continuous service availability.
The specific model of the Dell PowerEdge R370 servers indicates that the enterprise has selected a reliable and high-performance hardware platform to host the web application. This choice aligns with the requirements of a mission-critical, enterprise-grade web application.
Overall, the deployment diagram depicts a well-designed, scalable, and secure infrastructure for hosting a critical web application within the enterprise. The use of a firewall, high-speed switch, and multiple redundant web servers suggests a robust and fault-tolerant architecture that can meet the demands of the business.
8. Conclusion
UML Deployment Diagrams are a critical tool for visualizing and documenting the architectural aspects of a system. By understanding and effectively using deployment diagrams, you can communicate system design more effectively, collaborate with stakeholders better, and make informed decisions throughout the software development lifecycle.
9. References
- Visual Paradigm Guides. (2023, October 4). Harmonizing Agility and Visual Clarity: UML Modeling in Agile Development. Visual Paradigm. https://guides.visual-paradigm.com/harmonizing-agility-and-visual-clarity-uml-modeling-in-agile-development/ 22.
- Cybermedian. (2024, August 19). The Comprehensive Guide to Visual Modeling for Agile Software Development. Cybermedian. https://www.cybermedian.com/uml-and-visual-paradigm-the-comprehensive-guide-to-visual-modeling-for-agile-software-development/ 23.
- ArchiMetric. (2024, August 23). Introduction to UML Diagrams in Visual Paradigm. ArchiMetric. https://www.archimetric.com/introduction-to-uml-diagrams-in-visual-paradigm/ 24.
- BPI. (2016, March 31). Software Design Tools for Agile Teams, with UML, BPMN and More. BPI. https://www.businessprocessincubator.com/content/software-design-tools-for-agile-teams-with-uml-bpmn-and-more/ 25.
- Visual Paradigm. (n.d.). Free UML, BPMN and Agile Tutorials – Learn Step-by-Step. Visual Paradigm. https://www.visual-paradigm.com/tutorials/ 26.
- Software Informer. (2013, February 19). Visual Paradigm for UML Software Informer: version 10.1 information. Software Informer. https://visual-paradigm-for-uml.software.informer.com/10.1/ 27.
- GeeksforGeeks. (2017, October 27). Unified Modeling Language (UML) Diagrams. GeeksforGeeks. https://www.geeksforgeeks.org/unified-modeling-language-uml-introduction/ 28.
- Managed Agile. (2021, January 5). Is UML Still Relevant Today? How Is it Used in an Agile Environment? Managed Agile. https://managedagile.com/is-uml-still-relevant-today/ 29.
- Visual Paradigm Guides. (2023, September 12). Integrating UML Modeling into Agile Software Development: A Guide for Scrum and Kanban Teams. Visual Paradigm. https://guides.visual-paradigm.com/integrating-uml-modeling-into-agile-software-development-a-guide-for-scrum-and-kanban-teams/ 30.
- StackShare. (n.d.). Lucidchart vs Visual Paradigm. StackShare. https://stackshare.io/stackups/lucidchart-vs-visual-paradigm 31.
